


Key Takeaways
- Record Seller-to-Buyer Disparity: Nationally, home sellers outnumber buyers by 62.6%, marking the largest market imbalance in Redfin’s records dating back to 2013.
- Miami Dominates the Buyer’s Market: Miami officially stands as the nation’s strongest buyer’s market, featuring an unprecedented 158.9% surplus of home sellers over buyers in September 2026—up from 134.5% in August.
- Sun Belt Inventory Surge: Out of 50 major U.S. metropolitan areas analyzed, 41 (82%) are now buyer’s markets, driven primarily by robust residential construction, rising HOA/insurance fees, and elevated mortgage rates across Florida and Texas.
- Historic Buyer Leverage: High entry costs have driven total active homebuyers down to a record low of 928,892, granting qualified, capitalized investors and luxury buyers unrivaled negotiating power and leverage.
The Great Market Rebalancing: Sun Belt Inventory Reaches Historic Peaks
The U.S. housing market has officially crossed a monumental threshold. According to the latest data from real estate brokerage Redfin, home sellers now outnumber active buyers nationwide by 62.6%—the widest gap recorded since data tracking began in 2013. September 2026 marked the fourth consecutive month of record-setting seller surpluses, widening significantly from 56.9% in August.
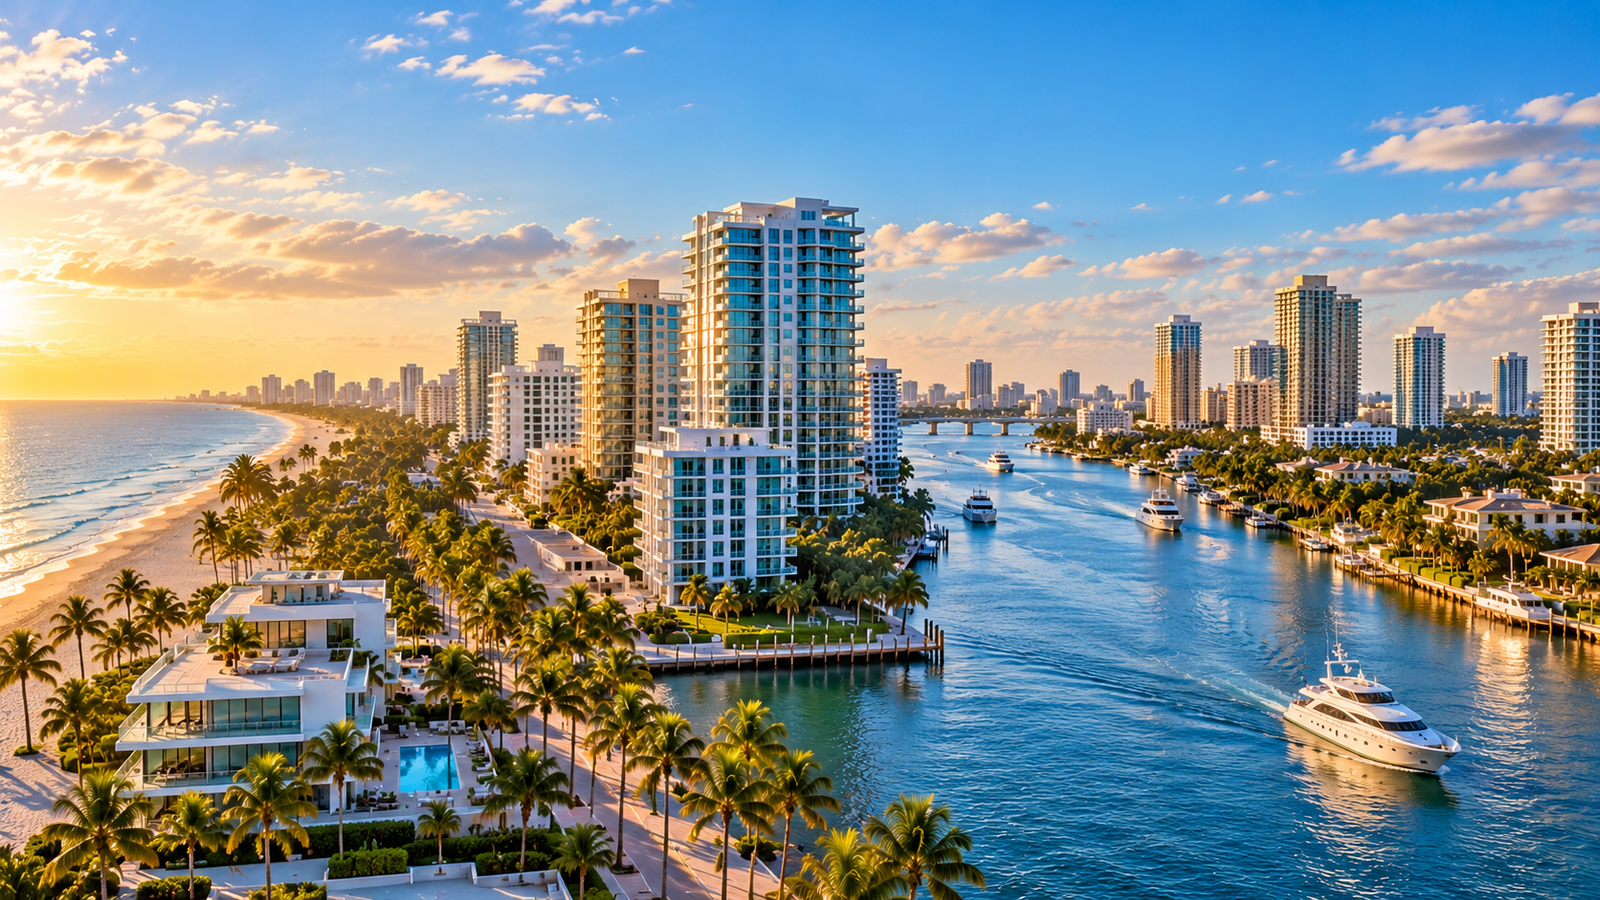
At the epicenter of this national real estate evolution sits South Florida, led by Miami. While the phenomenon spans 41 of the nation’s 50 most populous metro areas, the Sun Belt region—and Miami in particular—is witnessing an unprecedented shift in favor of purchasers.
+-----------------------------------------------------------------------+
|                U.S. HOUSING MARKET GAP (SEPTEMBER 2026)               |
+-----------------------------------------------------------------------+
|  Active Homebuyers (Record Low) : 928,892  (-2.4% MoM)                 |
|  Active Home Sellers           : 1,510,784 (+1.2% MoM)                 |
|  National Seller Surplus       : +62.6%    (4th Consecutive Record)   |
+-----------------------------------------------------------------------+
Miami Real Estate: Maximum Negotiating Leverage for Capitalized Buyers
In Miami, the disparity between inventory and active demand has expanded faster than anywhere else in the United States. In September, Miami recorded 158.9% more sellers than buyers, surging from 134.5% the previous month.
+-----------------------------------------------------------------------+
|                     TOP U.S. BUYER'S MARKETS SURPLUS                   |
+-----------------------------------------------------------------------+
|  1. Miami, FL   : +158.9% surplus of sellers (Up from 134.5% in Aug)    |
|  2. Tampa, FL   : +103.7% surplus of sellers (Up from 82.2% in Aug)     |
|  3. Warren, MI  : +47.1%  surplus of sellers (Up from 27.3% in Aug)     |
+-----------------------------------------------------------------------+
In South Florida, several unique structural forces have converged to build this inventory pool:
- Construction & Delivery Pipelines: Years of robust homebuilding and multi-family deliveries across South Florida continue to introduce inventory to the market.
- Evolving Holding Costs: Beyond elevated mortgage borrowing costs, regional homeownership expenses—specifically HOA fees and property insurance premiums—have encouraged long-term holders and investors to list properties.
- Seller Motivation: Having remained on the sidelines waiting for interest rate drops, many homeowners are listing due to lifestyle transitions, desire to capture remaining home equity, or concerns over potential future price corrections.
National Contrast: 41 Buyer’s Markets vs. Just 5 Seller’s Markets
The market split across America reflects stark regional disparities in housing construction and economic drivers. Across the 50 major metropolitan areas analyzed:
- Buyer’s Markets (41 Metros): Dominating the Sun Belt, led by Miami, Nashville, and Houston, alongside major Florida hubs like Tampa (+103.7% surplus).
- Balanced Markets (4 Metros): Regions hovering within the +/- 10% equilibrium band, including New England centers like Boston (+7.4%) and Providence (+2.4%).
- Seller’s Markets (5 Metros): Highly supply-constrained submarkets, led by Nassau County, NY (-28.6%), Montgomery County, PA (-22.7%), Newark, NJ (-18.5%), Milwaukee (-16.1%), and San Francisco (-10.6%).
In the five isolated seller’s markets, intense buyer competition pushed average home sales prices up 6.4% year-over-year in August, compared to a modest 1% uptick across buyer’s markets nationwide.
What This Means for South Florida Investors and High-Net-Worth Buyers
For luxury buyers, family offices, and institutional investors evaluating South Florida real estate, current market conditions represent the most advantageous acquisition environment in over a decade.
While baseline housing costs have sidelined entry-level purchasing volume—driving total national buyer numbers down to 928,892—well-capitalized acquisitions teams are positioned to secure prime real estate on flexible terms, obtain seller concessions, and negotiate price adjustments that were unattainable during the peak hyper-competitive years.
Stay Ahead of the South Florida Real Estate Market
Subscribe to Miami Real Estate Magazine for exclusive market reports, expert intelligence, and luxury development insights. Share this analysis with your network or business partners today.